
tooltip style과 body
map과 info만 있으면 된다
<style>
      #map {
        position: relative;
      }
      #info {
        position: absolute;
        height: 1px;
        width: 1px;
        z-index: 100;
      }
      .tooltip.in {
        opacity: 1;
      }
      .tooltip.top .tooltip-arrow {
        border-top-color: white;
      }
      .tooltip-inner {
        border: 2px solid white;
      }
    </style>
  </head>
  <body>
    <div id="map" class="map"><div id="info"></div></div>
  //
  </body>
그리고 많이 헤맸는데 tooltip을 openlayers의 example그대로 사용하려면 부트스트랩을 데려와야한다
순서 꼭 지킬것.....jquery -> jquery-ui -> bootstrap임...
<script src="${contextPath}/js/jquery-3.4.1.min.js"></script>
<script src="${contextPath}/js/jquery-ui.js"></script>
<script src="https://maxcdn.bootstrapcdn.com/bootstrap/3.3.2/js/bootstrap.min.js"></script>
툴팁의 내용을 올려줄 변수를 설정하고 맵 위에 마우스올렸을 때 주는 이벤트에서 설정을 시작한다
나는 시간이 없기도했고 데이터도 별로 없어서 아래와 같이 마우스 올렸을 때 매번 url을 통해 feature를 가져오는 방법을 사용했는데 추후 fetch를 사용해서 좀 더 효율적인 소스로 수정하고 좀 더 모듈화를 시킬생각이다...
var info = $('#info');
info.tooltip({
animation: false,
trigger: 'manual'
});
//맵위에 pointer올렸을때
map.on('pointermove', function(evt) {
if (evt.dragging) {
info.tooltip('hide');
return;
}
var viewResolution = /** @type {number} */ (map.getView().getResolution());
var coordinate = evt.coordinate;
var url = sku_living_layer.getSource().getGetFeatureInfoUrl(
coordinate, viewResolution, epsg_cd,
{
'INFO_FORMAT': 'application/json',
'VERSION': '1.1.1',
'FEATURE_COUNT' : 10,
}
);
url = changeXY(url);
getFeature(url,evt);
displayFeatureInfo(map.getEventPixel(evt.originalEvent));
});
//feature값 가져오기
function getFeature(url,evt){
$.ajax({
url : url,
dataType : "json",
success : function(data) {
if(data.features[0] !=undefined){
feature = data.features[0].properties;
displayFeatureInfo(map.getEventPixel(evt.originalEvent));
}else{
feature = '';
};
}
});
}
//tooltip설정
var displayFeatureInfo= function(pixel) {
info.css({
left: (pixel[0] +250) + 'px',
top: (pixel[1]-10) + 'px'
});
if (feature) {
info.tooltip('hide')
.attr('data-original-title', feature.fclt_nm)
.tooltip('fixTitle')
.tooltip('show');
} else {
info.tooltip('hide');
}
};
//좌표 X Y변환
function changeXY(url){
url = url.replace("I=", "X=")
.replace("J=", "Y=");
return url;
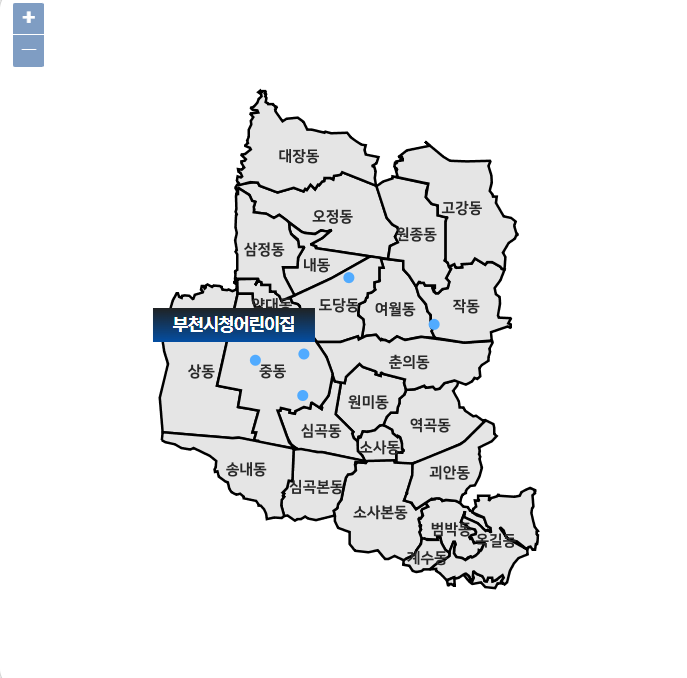
}저 tooltip에 대해서 좀 더 설명하자면 data-original-title에 내용을 넣으면 해당 내용으로 툴팁이 생성된다
그러면 이렇게 마우스 올렸을 때 툴팁이 잘 뜬다
상세 스타일이나 위치는 따로 수정한것임...
참고 ref
https://openlayers.org/en/v4.6.5/examples/kml-earthquakes.html
Earthquakes in KML
Demonstrates the use of a Shape symbolizer to render earthquake locations. This example parses a KML file and renders the features as a vector layer. The layer is given a style that renders earthquake locations with a size relative to their magnitude.
openlayers.org
'QGIS·Geo' 카테고리의 다른 글
| [geoserver]strict-origin-when-cross-origin geoserver의 cross domain(cors)허용 (0) | 2022.08.02 |
|---|---|
| [geoserver] OGC filter를 통해 값마다 스타일 지정해주기, 범례설정 (0) | 2022.06.29 |
| [geoserver] SQL 뷰에서 parameter설정, 정규식, 파라미터 오류, 여러개의 변수 구분 (0) | 2022.06.23 |
| [openlayers] openlayers활용하여 웹상에 지도올리기 (0) | 2022.06.21 |
| [QGIS, geoserver] 간단하게 point 레이어 올려보기, 변수(parameter)설정하여 레이어 불러오기 (0) | 2022.06.21 |


댓글