
728x90
SMALL

난 이런식으로 단색으로 하고싶었다
하루죙일 찾아봤는데 그라데이션으로 변경되는 것 밖에 못했었다
하지만 결국 답을 찾아냈다
감사합니다 스택오버플로우.....
자세한 소스설명은 소스안에 주석으로 넣어놈..
<canvas id="canvas"></canvas>//파라미터로 라벨, 데이터, 기준값을 가져옴
function setFungChart(labels,data,maxValue){
const ctx = document.getElementById("canvas").getContext('2d');
//나는 파라미터로 data와 labels를 가져와 data.data와 data.labes안에 넣어줬다
var data = {
datasets:[{
//y축 data
data: data,
//기본 borderColor가 없으면 그라데이션이 됨. 난 단색으로 하고싶어서 넣어줌
borderColor: '#6fba2c',
//얼마나 부드러울 것이냐. 낮을 수록 꺾은선 됨
tension:0.4
}],
//date나 시간 같은 x축
labels: labels,
};
//차트만들기
lineChart = new Chart(ctx, {
type:'line',
//여기서 색을 넣어주는것
plugins: [{
afterLayout: chart => {
let ctx = chart.ctx;
ctx.save();
let yAxis = chart.scales.y;
//기준값을 넣어준다
let ymaxValue = yAxis.getPixelForValue(maxValue);
let gradient = ctx.createLinearGradient(0, yAxis.top, 0, yAxis.bottom);
//기준선 넘었을 때 색상은 #dc0e0e (빨간색)
gradient.addColorStop(0, '#dc0e0e');
let offset = 1 / yAxis.bottom * ymaxValue;
gradient.addColorStop(offset, '#dc0e0e');
gradient.addColorStop(offset, '#6fba2c');
//기준값 아래의 색상은 #6fba2c (연두색)
gradient.addColorStop(1, '#6fba2c');
chart.data.datasets[0].borderColor = gradient;
ctx.restore();
}
}],
//위에서 설정한 data값 가져옴
data:data,
options:{
maintainAspectRatio:false,
plugins:{
legend:{
display:false
}
},
clip: false,
scales:{
y:{
ticks:{
beginAtZero: true,
callback(value){
if(value%1===0){
return value;
}
}
},
grid:{
display:false
}
},
x:{
grid:{
drawBorder:false
}
}
}
}
});
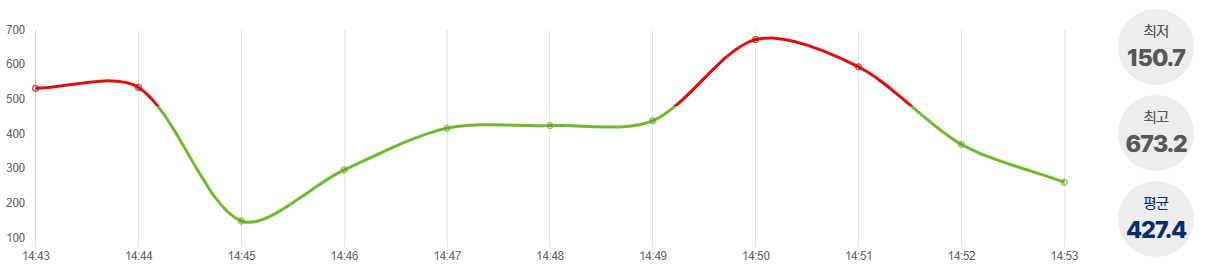
이렇게 원하는대로 500이상만 빨간색이고 아래로는 연두색이도록 차트가 완성이 되었다
참고 ref
https://stackoverflow.com/questions/72193266/changing-line-color-below-specific-value-in-chart-js
Changing line color below specific value in Chart.js
I am trying to color the line below a specific value a certain color. I am using Chart.js v3.7.1 I have implemented the solution found in this answer with partial success... let posColour= 'rgb(8...
stackoverflow.com
728x90
LIST
'Front > Javascript·Jquery' 카테고리의 다른 글
| javascript로 주소창에 있는 parameter받기, 넘겨준 파라미터받기 (0) | 2022.08.25 |
|---|---|
| jQuery.ajax() 중복요청 처리 방지하기 (0) | 2022.08.16 |
| jquery 스크롤이 있는 영역의 특정한 행으로 스크롤 이동하기, offset안먹힐때 , position (0) | 2022.07.11 |
| [javascript ,jquery] trigger 처음에 안먹힐때, 클릭이벤트 안먹힐 때, document trigger click, 동적이벤트 후 트리거 (0) | 2022.07.05 |
| javascript click이벤트 안먹힐때, 어떤 함수실행 후 재클릭이벤트 안먹힐때 (0) | 2022.07.05 |


댓글